CFD analysis and validation/Korean Nuclear Society Spring Meeting 2026 · 2026
How far can the cheap computation stand in for the expensive one?
Flow crossing a tube bundle sheds vortices behind each tube, and the resulting pressure swings shake the tubes. Predicting that shaking calls for LES, which is expensive. We asked how far the much cheaper DES can stand in, judged on surface pressure.
- Bum Jin Cho
 Min Seop Song
Why this matters
Small modular reactors have to move a lot of heat in a tight envelope, so helical coil steam generators (HCSG) are a common choice. Their tubes sit across the main flow and intersect one another, so the coolant crosses the bundle rather than running along it.
That cross-flow separates behind each tube and leaves a wake, and the surface pressure never settles. That is flow-induced vibration (FIV). The unsteady loads have to be quantified at the design stage for the plant to run for decades.
But RANS, built on time averaging, damps out vortex shedding and wall-pressure fluctuation. LES recovers them at a price. DES is the compromise: RANS near the wall, LES-like resolution in the separated and wake regions. Whether that compromise also holds up on a pressure basis is the question here.
Around a single tube
Each angle is a different story
Measuring the angle θ around the central tube, the character of the flow changes with position.
Velocity field from a direct solution of the two-dimensional incompressible Navier–Stokes equations. Not the paper's condition: only the pitch ratio P/D = 1.32 matches. This field is laminar (Re 100 on tube diameter, about 410 on gap velocity); the paper's is Re = 7.82 × 10⁴.
Drag the handle to change the angle.
θ ≈ 0° · stagnation
Where the flow runs head-on into the tube and stops. The pressure is highest here, and this is also where all three models agree with the experiment.
The case
One wind-tunnel experiment as the yardstick
We took one representative condition from a published wind-tunnel benchmark, ran all three turbulence models on it, and compared the circumferential mean pressure coefficient Cp̄(θ) on the central tube directly against the measurement.
- Pitch ratio P/D
- 1.32
- Inlet velocity U
- 7 m/s
- Gap velocity Ug
- 29.2 m/s
- Reynolds number
- 7.82 × 10⁴
- Tube diameter D
- 38 mm
- Statistics window
- 0.04 – 0.24 s
The three models
- URANS (SST k–ω)A low-cost baseline for the mean flow and mean pressure field
- LES (WALE)The high-fidelity reference: near-wall turbulence and unsteady wakes resolved
- DES (SST-IDDES)RANS near the wall, LES-like in separation and wake — the compromise
The mesh
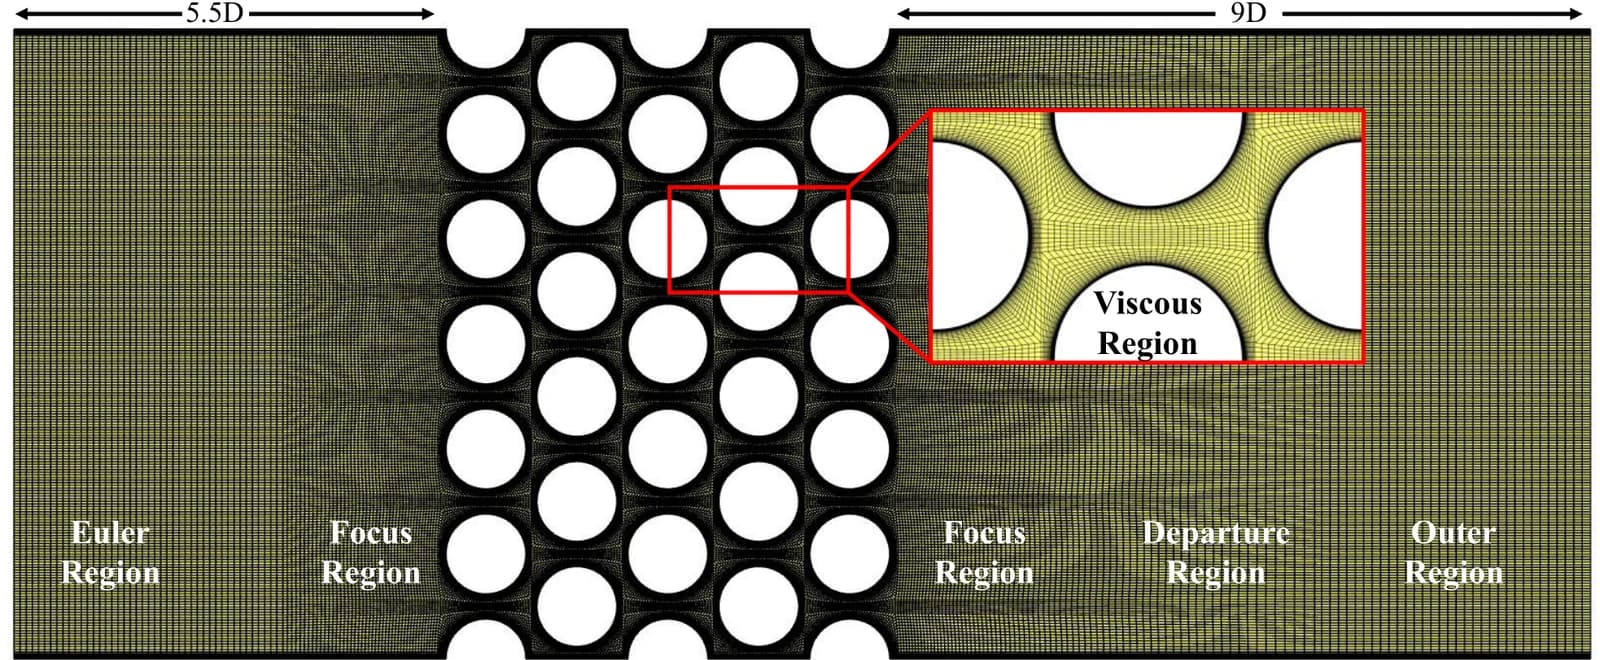
Built so IDDES switches modes smoothly
The DES mesh keeps URANS-Medium quality near the wall and LES-like resolution through the wake, so that the two modes hand over to each other without a jump.
Result one
They agree at the stagnation point and part ways in the wake
Near the front stagnation point (θ ≈ 0°) all three models match the experiment. They separate in the separation and wake regions. LES follows the pressure recovery around θ ≈ 180°, whereas DES underpredicts it and ends up looking like URANS.
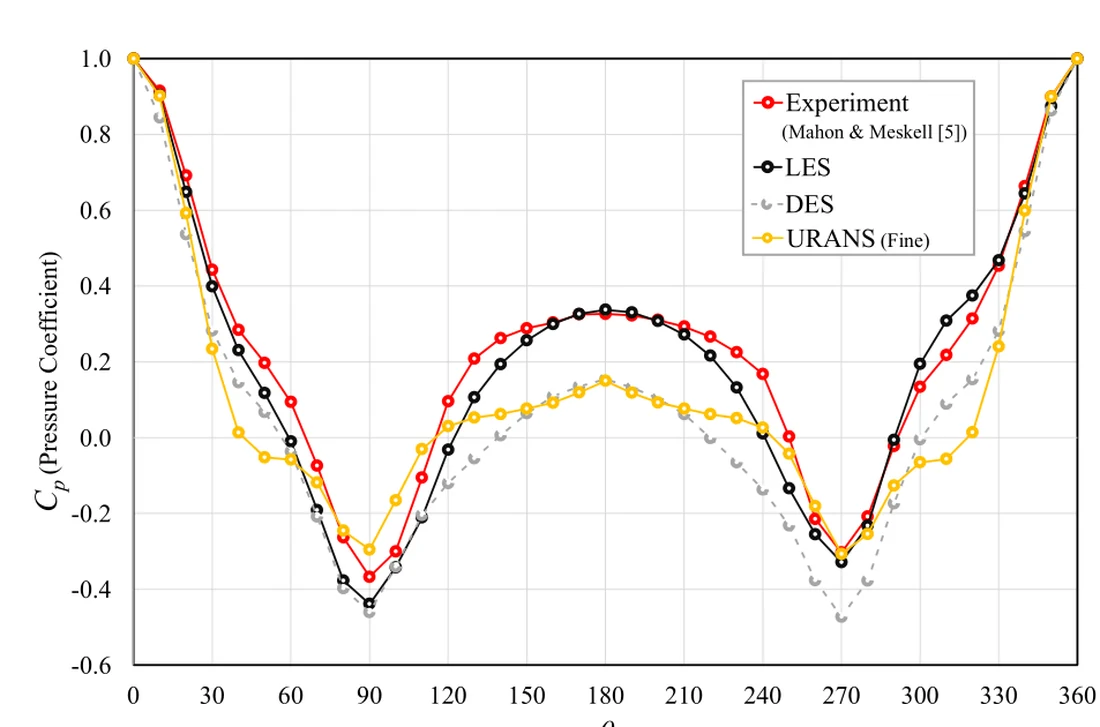
Discrepancy from the experiment (Table Ⅳ of the paper)
| LES | DES | URANS | |
|---|---|---|---|
| RMSE | 0.070 | 0.1786 | 0.1645 |
| MAE | 0.0550 | 0.1648 | 0.1392 |
| Mean Error | -0.0404 | -0.1648 | -0.1205 |
| Max |Δ| | 0.1573 | 0.3048 | 0.3000 |
| Angle at Max |Δ| | 240° | 240° | 320° |
Result two
The same mean can hide a different tremor
Taking the spectrum of the wall-pressure time series shows that the dominant frequency differs even where the mean Cp is similar. At θ ≈ 90° the DES peak drops to less than half the LES one, pointing to a stronger low-frequency contribution.
| Position | LES | DES |
|---|---|---|
| θ = 90° | 117.19 Hz (St 0.153) | 58.59 Hz (St 0.076) |
| θ = 180° | 195.31 Hz (St 0.254) | 205.08 Hz (St 0.267) |
So
A velocity-field check alone misses things
DES validations usually compare velocity fields. This work took surface pressure and FIV-relevant unsteady metrics as the yardstick instead, because those are what design loads are made of.
The verdict is a qualified pass. The broad shape of the mean pressure comes out, but the wake-side recovery is systematically underpredicted. Using DES in place of LES at this condition means knowing that bias is there.
What comes next (as the paper sets out)
- 01A longer statistics window, to check low-frequency content and the convergence of mean quantities
- 02The same metrics re-measured at lower velocity and lower Reynolds number (U = 2–3 m/s)
- 03Sensitivity to wake-region resolution and to the RANS–LES transition behaviour
- 04Particle image velocimetry (PIV) validation of the wake and gap flow for representative cases
Source
B. Cho · M. Song, “Pressure-Based Assessment of SST-IDDES for Surface Pressure and FIV-Relevant Metrics in Staggered Tube-Bundle Cross-Flow”, Korean Nuclear Society Spring Meeting 2026, 2026.
See the CFD analysis and validation area